Research-Driven.
A complex and ever-changing investment landscape provides challenge and purpose for our team.
The Case for International
August, 2020 | Jason M. Gowen, CFA
Global diversification is an integral component of Gerber Taylor’s approach to asset allocation; however, given the recent dominance of the S&P 500 Index and the natural tendency of investors to extrapolate recent trends far into the future, many are questioning the value of an allocation to international equities. Here, we will review the case for international equities given our implementation of the strategy via active management.
- US and international equities each tend to have winning streaks. The combination of the two provides diversification benefits and creates a more stable return profile over time.
- After a very long winning streak for US equities and the US dollar, international equities are cheaper, along with cheaper currencies as a possible tailwind.
- International markets are less efficient and offer a significantly larger pool of stocks to analyze. This provides the opportunity for significant outperformance from active management.
Take the Dogs to Cover the Spread
We think a good metaphor for the current US vs. non-US debate can be found in college football. Rivalry games between established powers have some similarity to the competition between US and foreign stocks.
Rivalries between evenly matched teams tend to be closely contested over the long haul but susceptible to streaks over shorter periods. In that vein, the S&P 500 and EAFE “game” is largely contested by huge businesses well known to their competitors (i.e., they both have four- and five-star recruits). At present, USA State has beaten EAFE Tech several years in a row, though the long-term rivalry is still pretty evenly matched. In recent years, the winner has been decided by some atypical factors (e.g., turnovers, special teams, trick plays, etc.). While these things frequently factor into outcomes, it is historically unusual that they all break in one direction for several years in a row.
Heading into 2021, USA State’s boosters are feeling confident and vocal. Next year is projected to be another cakewalk since they have multiple 1st team All-Americans (tech stocks), Nick Saban (the Fed), the best facilities (the US economy), a ferocious defense (the US legal system), etc. That all may be well and true, but our interest is focused on movements in the point spread. Usually, the betting line reflects evenly matched programs and the spread is ± 7 points or one touchdown. This year, the USA State bandwagon appears to be at maximum capacity and the current line is USA 42 points.
Now, we have exposure to both teams (allocations to each asset class) and are willing to bet on either (commit additional capital) if the odds are favorable. “Who is the better team (the straight up winner)?” is not a question that we are trying to solve. If we are going to bet, we’re taking EAFE Tech and six touchdowns. Admittedly, USA State does look pretty solid. We might feel differently if the spread were +10, but 42 points is way outside the average margin of these games.
The best part of this metaphor is that we don’t have to bet on the S&P 500 or EAFE. We can create our own “fantasy team” by drafting only the players we want (we hire active managers who pick their own stocks). Rather than suit up EAFE Tech, we can trot out our own hand picked team at game time. Given the fact that we believe it is a much higher quality portfolio (has better players), we think taking the points is a no brainer. Similarly, we believe prices are such that an international portfolio will be hard pressed to underperform the US stock market over the medium-term (three to five years) from these levels.
Executive Summary
This paper looks at past return cycles for US and developed foreign stocks. The latest pullback comes on the heels of several years of unusually divergent equity outcomes. US equities have produced substantial gains, notably so within the technology space. Non-US stocks have lain comparatively fallow. Combining sustained investment profits with easy access and familiar companies, the S&P 500’s torrid stretch has engendered rising confidence that geographic diversification subtracts value. Tumultuous trading conditions thus far in 2020 have done nothing to break the spell.
Our analysis of current circumstances arrives at a different conclusion. Our contention is that, three to five years hence, international equities could realize returns significantly higher than those for the S&P 500. Accessing those returns requires a bit of contrarianism, though we believe our case is logical and supported by past evidence and current valuations. Should you agree with our reasoning, it follows that any imbalance is most profitably addressed while valuations are accommodating rather than later when the bandwagon starts filling up.
Why International – Theory
The case for investing in international stocks rests on one’s ability to extract long-term profits from the investment. Metaphorically, foreign exchanges are simply another pond in which to fish. US stocks can be accessed for virtually nothing in today’s world, so an international allocation should be expected to earn long-term results competitive with passive US strategies to merit a place in the portfolio. Cyclical factors often muddy the comparisons, but our objectives are the same in both the US and foreign markets: earn a high compounded real rate of return and avoid permanent capital impairment. Presumably, this compares favorably to passive benchmarks.
The table above details very long-term returns for the US stock market and a range of developed counterparts as calculated by MSCI. Assuming your goal is simply to earn the highest possible long-term return, there does not appear to be any particular advantage associated with limiting
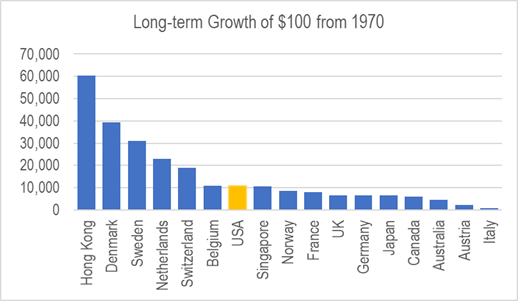
oneself to US stocks. If the US were in the same position as Hong Kong, the best performing country over the past 50 years, then investing abroad would be a much tougher sell.
Why International – Practice
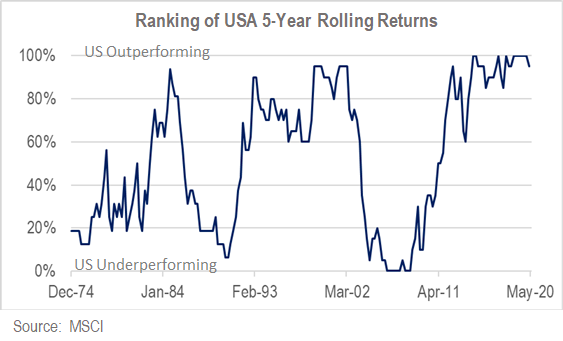
The cyclicality of the relationship between US and non-US stocks is often underappreciated. Typically, one might expect to find the US in the middle of a larger set of country returns over intermediate periods. In practice, viewed over rolling five-year periods, US equity leadership is a bit of a penthouse or outhouse affair. Since five years is often a proxy for “long-term” in an institutional setting, such a reversal from an established trend is a phenomenon known as “regime change.” Regime change appears endemic in global equity allocations. Simply looking at the ranking of US equity returns within a broader group of developed countries, one can see that the US stock market spends more time in the outer thirds of a peer universe than it does in the middle. Presently, US stocks are coming off a period of sustained top decile results. Should we expect more of the same? Are foreign stock markets irretrievably broken?
A look at prior cycles during the past twenty years may be useful. Given that the financial services industry is not known for having a particularly lengthy institutional memory, we find this longer perspective helpful in terms of not getting too carried away with prevailing sentiments. p
US vs. International – Recent Cycles
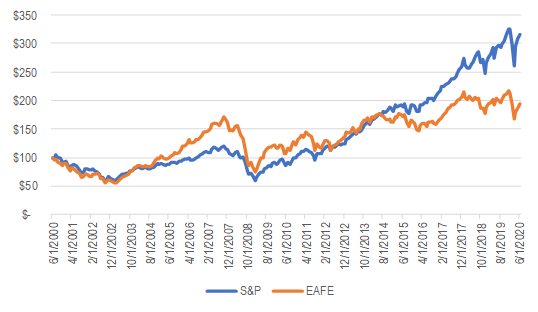
The graph above segments the cumulative results for the S&P and EAFE into three discrete periods over the past 20 years. We will briefly review each period and provide some context for cyclically divergent outcomes. We will also recap current pricing and how that informs our return expectations. If that sounds like a suboptimal use of your time, here is our basic conclusion. Many investors appear to be expecting a continuation of Period 3 and positioning their portfolios accordingly. In contrast, based on current pricing, we expect the medium-term future to rhyme with Period 1.
Period 1 (Technology Bubble & Recovery)
Period 1 begins in mid-2000, one quarter after the NASDAQ bubble peaked in March and runs for 7½ years until the end of 2007. The years leading up to the new millennium saw US markets reign supreme. The Asian Crisis of 1997 and uncertainty from the euro’s launch in 1999 channeled capital into the US, driving up financial assets and the dollar. Following the market peak, equity prices crested as a recession unfolded and remained under pressure for the better part of two years.
The early 2000s bear market segued into a synchronized global boom. The US dollar tumbled as well. Cross border capital flows proliferated and deal making flourished. Conditions favored non-US stocks. The international index exceeded the US benchmark for five consecutive years, all of which were double-digit gains (for the foreign index). Over the entire period, foreign stocks outperformed US stocks by ~5% per annum.
As they are wont to do, markets got a little carried away. The latter years in Period 1 were characterized by credit market excesses and a misplaced belief that cyclical industries had entered a profit super cycle.
Period 2 (Global Financial Crisis & Transition)
Period 2 starts at the beginning of 2008 and runs through the end of 2011. This interval begins with the global financial crisis and ends with European financial strains. It was an ugly four years for the international benchmark, which entered 2008 with large exposures to banks and the energy/resources complex. US stocks fared better. Nonetheless, “lots of motion, little progress” is a fitting summary for the equity experience here.
Period 3 (USA Stock Market Juggernaut)
Period 3 ushered in a new dominant era for US equities. This era is epitomized by Facebook, which went public in May of 2012 and has a public equity value of ~$700 billion today, making it one of the five biggest companies in the world by equity capitalization. Furthermore, US stocks have been both profitable and well behaved, an atypical combination. Through June 2020, the US index has compounded at 13.6% per annum, or a ~200% cumulative return. Seven of eight calendar years have produced gains, six of them posting double-digit advances. It has been quite a turnaround for the S&P 500 investor. Roughly speaking, the past eight years have been more than 30 times as profitable as the preceding twelve. Looking at this table, we have our suspicions about the persistence of Period 3.
Circumstances also improved for non-US stocks but nothing on par with American markets. Initially, foreign equities kept up with their American peers, but returns have diverged to an unusual extent in the past three to four years. While prices have advanced, so has the US dollar, partially offsetting those gains. Another factor has been the lack of any global software giants and their meteoric stock price trajectories. Developed markets have their digital companies, but the super-sized ones which have powered the indices are only found in the US and China at present.
Where Do We Go from Here?
To further highlight the discrepancies we see between price and value, and consequently forward-looking return prospects, we submit portfolio information from two regional managers that we utilize. Both operate diversified portfolios. One manages Japanese equities and the other invests only in the United Kingdom.
For the S&P 500, normalized valuations turned down in the 2008 financial crisis but have generally moved up, up, and away since. While not perfectly correlated, it is generally accepted that the CAPE figure (i.e., S&P 500 price divided by trailing 10-year average earnings as popularized by Robert Shiller) is directionally accurate regarding long-term S&P 500 return potential. Meanwhile, our managers in the UK and Japan have been more disciplined about valuations, producing portfolios increasingly out of step with trends driving the S&P 500 Index. As an example, neither manager has more than 5% of their fund invested in technology stocks. Meanwhile technology exposure has risen to 28% of the S&P 500, and the S&P 500 has become significantly more top-heavy in the process.
The table below is intended to frame some expectations for future returns. It presents June 2020 valuation data and a projected growth rate for future earnings. We have used the historic long-term EPS growth rate through 2019 so that the COVID earnings hit does not bring down long-term estimates. Inception dates for the various earnings figures date to 1988, 2005, and 2007 for the S&P, UK manager, and the Japan manager, respectively.
| S&P 500 | UK Manager | Japan Manager | |
|
Normalized P/E
|
29.2x
|
10.9x
|
8.8x
|
|
Normalized Earnings Yield
|
3.4%
|
9.2%
|
11.4%
|
|
Dividend Yield
|
1.9%
|
4.5%
|
4.%
|
|
Historic Long-Term Trend EPS Growth
|
6.2%
|
10.6%
|
7.0%
|
In looking at this table, we are hard pressed to muster much enthusiasm to make a long-term commitment to the S&P 500 at current prices. The alchemy that transmutes mediocre earnings into best-in-class returns is multiple expansion. Given that S&P 500 returns have been compounding significantly faster than earnings, rising US equity valuations have created a bit of a bandwagon effect. Investors understandably want to maximize short-term outcomes. Institutions reacting to realized returns of the past three to five years are looking to add more of what’s working (e.g., large US tech stocks) and reduce or eliminate that which is not (e.g., non-US stocks, value stocks, etc.). While rational at a high level, this phenomenon has gathered sufficient momentum so as to create atypically wide valuation dispersions at the individual stock level. In summary, cheap stocks are unusually cheap and vice versa.
That said, we have no clue as to any catalysts that will cause prices to break our way, though we can speculate on a few. Nonetheless, we are confident that our managers can keep underlying values growing at a healthy clip while we wait. In the meantime, we are collecting a dividend yield in excess of the S&P 500’s earnings yield from these two portfolios. It seems that more than a few investors have interpreted the past three to five years as some sort of “New Normal” that will remain in place for the foreseeable future. For the status quo to carry on for another three to five years, you would have to believe that 1999 growth equity valuations could co-exist with 1974 value equity prices. Even by financial market standards, that seems an unlikely possibility.
August, 2020
Jason M. Gowen, CFA
Disclosures: The discussions and opinions in this letter are for general information only, and are not intended to be, nor should it be construed or uses as investment, tax, ERISA or legal advice. While taken from sources deemed to be accurate, Gerber Taylor makes no representations about the accuracy of the information in the letter or its appropriateness for any given situation. Opinions offered constitute our view and are subject to change without notice. This information does not constitute an offer to sell, or a solicitation of any offer to buy any security, including an interest in any private fund. Any offer or solicitation of an investment in any private fund may be made only by delivery of the confidential offering memorandum of such private investment fund to qualified investors.