Research-Driven.
A complex and ever-changing investment landscape provides challenge and purpose for our team.
The Role of Private Equity in Portfolios
October, 2021 | Sean Montesi & Kojo McLennon
Private equity offers a number of desirable characteristics for long-term investors:
- Tax-Efficient, High Return Potential
- Large and Growing Opportunity Set
- Diversification Benefits
Given these attributes, it is not surprising that private equity continues to receive greater focus in investment portfolios. The largest and most sophisticated university endowments have an average allocation to private equity of nearly 26% . One of the most widely followed and emulated investors, the Yale Endowment, has an ~38% allocation to private equity and venture capital. We would be hard-pressed to recommend that degree of illiquidity for most investors but believe those with a long time horizon should consider a consequential allocation. Given the return outlook for traditional stocks and bonds from current levels (see our recent musings in Dusting Off Our Crystal Ball), we expect private equity to serve a crucial role in generating satisfactory portfolio returns.
Private equity is a large and complex market, populated by a vast number of strategies and managers. Navigating this space requires deep experience, strong manager relationships, and a continuous presence. Gerber Taylor has deployed and harvested private equity investments across every type of market environment since the program’s inception in 1995, ranging from the euphoric to the despondent. Over this time, and including all vintages, our program as a whole has earned an excess return net of fees relative to the S&P 500 public market equivalent (measured by both multiple on invested capital “MOIC” and internal rate of return “IRR”.)
Tax-Efficient, High Return Potential
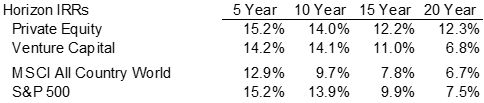
Private equity is expected to deliver high returns in exchange for the associated risks and illiquidity, and the industry has delivered. Private equity (“PE”) and venture capital (“VC”) have generated excess returns relative to public markets over the medium and long-term:
The number of opportunities coupled with the opacity of private markets (no public reporting requirements, no quoted pricing, unstructured sale processes and capital raising, personal relationship dynamics, etc.) creates inefficiencies which historically have translated into excess returns. Happily, for taxable investors, PE and VC returns are also tax efficient. Nearly all investments are held for more than one year, thus qualifying realizations for long-term capital gains treatment. Furthermore, most PE and VC investments are held for many years (generally five to 10 years), so gains are deferred.
PE and VC returns have been particularly strong over the last decade, driven in large part by favorable market conditions. Low interest rates, rising public equity markets, and robust fund raising, among other factors, have all been supportive. These factors are unlikely to continue unabated, which may require a combination of more discernment in manager selection and adjusted return expectations for a successful program going forward.
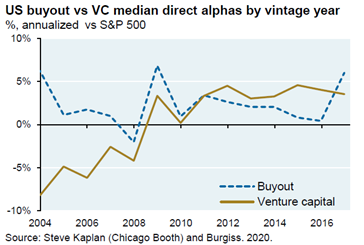
As you can see in the chart below, buyout and VC performance versus the public market benchmark varies by vintage, with VC being more variable. However, the average outperformance (“alpha”) over this period is 0.3% for VC and 2.4% for buyout. A simple average of those numbers yields just over 1% of excess return versus public markets.
What, then, is a reasonable expectation going forward? The 1% historical outperformance of the median portfolio is probably a reasonable expectation prospectively; let’s say 0-1% for the sake of conservatism. On the other hand, we have a higher degree of confidence in the persistence of our manager selection value-add. Let’s say we can look for 2-3% outperformance from manager selection. Combining the two, we think 2-4% outperformance versus public markets is a reasonable expectation going forward. We aspire to, and believe we can, achieve outperformance in excess of that 2-4%, but expecting it might be presumptuous.
Forecasting public equity returns is beyond the scope of this paper. However, it is safe to say that most forecasts predict public equity returns to be lower than they have been over the last 10-15 years. The lower your expectations are for public equities, the more important a well-constructed private equity program becomes to achieving a desired total portfolio rate of return.
Large and Growing Opportunity Set
While many may equate private equity with just leveraged buyouts, the space actually incorporates a wide breadth of strategies for varying risk tolerances and objectives. For example, i) secondaries offer quicker deployment and liquidity, ii) distressed offers deep value (low prices) and turnaround risk, iii) private credit offers lower risk and return, with cash flow, iv) buyouts offer operationally-driven value enhancement augmented with leverage, v) growth equity, and venture capital to a greater extent, offer high risk and high return. Within each category, there are many sub-categories based on geography, sector, size, etc. Our goal is to sift through that extensive menu of options to identify those offering the most attractive combinations of risk, reward, and manager talent. Of late, we have been primarily focused on buyouts and VC & growth equity as having the richest and most durable opportunity sets.
The net asset value of global private equity deployed has grown ~10x since 2000, far outstripping the ~3x growth in public market capitalization. While the global private market AUM of ~$7 trillion still pales in comparison to the nearly $100 trillion of global public equity market capitalization, private market investments have become a core component of institutional and family investment allocations. There has been similar growth in the number of private market focused investment firms, which now number over 10,000 globally (exceeding the number of hedge funds, for comparison).
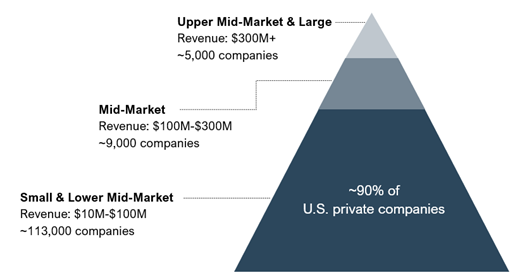
These increases are consistent with the large and growing opportunity set private equity seeks to address. There are around six to seven million private businesses in the United States (many more if including sole proprietorships). Within those millions of businesses, there are ~127,000 with revenues exceeding $10 million, which we assume is a rough demarcation for an investable business. ~90% of those (~113,000) have revenues of $10-100 million and make up the small and lower middle market. This is where our preferred buyout GPs direct most of their attention. We are quite confident that the degree of inefficiency in valuing and investing in businesses among a universe of >100,000 is far higher than if we focused up-market on the ~5,000 private companies that generate revenues in excess of $300 million, the domain of the large buyout funds that account for the majority of the fundraising and dry powder in the buyout industry.
In addition to the sheer volume of established, private cash-flowing businesses in existence, demographic trends support a growing need for private equity capital in those businesses. Over 10,000 baby boomers (born 1946 to 1964) reach retirement age every day, with the last of the boomers reaching age 65 by 2030. While many business owners have succession plans in place, many others do not and often seek private equity investors to facilitate liquidity upon retirement.
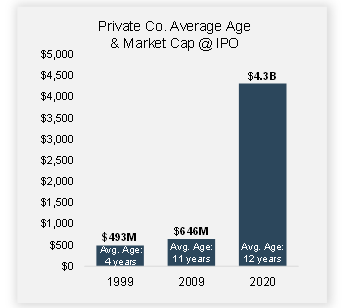
More specifically, the size of the addressable opportunity for VC & growth equity has grown materially over the last 10-20 years. The median capital raised prior to an IPO went from $42 million in 2000 to $167 million in 2020. The average age of technology companies at IPO in 1999 was four years, as of 2020 it was 12 years. The average market cap at IPO over that time has gone from $493 million to $4.3 billion . The scale of the VC & growth equity opportunity and the amount of value created in the private markets has expanded exponentially. This trend seems poised to continue, albeit surely with interruptions in the process
VC & growth equity-backed companies are staying private longer, raising more capital as private companies, and reaching greater scale before accessing public markets. This is being driven by both greater availability of VC & growth equity funds as well as those GPs’ desire to realize more of their portfolio companies’ growth and commensurate returns before exiting and ceding future growth and returns to public market investors or an acquirer. According to the National Venture Capital Association, more than 10,800 companies in the U.S. received venture funding in 2020 alone. This represents one year of funding, so the total addressable market of opportunities is immense. The U.S. represents around half of global venture funding, making the opportunity globally even larger. In contrast, the number of public companies has generally been declining over recent decades. Since peaking at just over 8,000 in 1996, the number of publicly listed companies in the U.S. had fallen by nearly 50% to just over 4,000 by 2012 and has since stayed relatively flat – that downward trend has abated of late with the greater pace of IPOs and SPAC listings in 2020/21.