Research-Driven.
A complex and ever-changing investment landscape provides challenge and purpose for our team.
Why Bother with Diversification?
January, 2022 | Tara Elliott & Charles Gerber
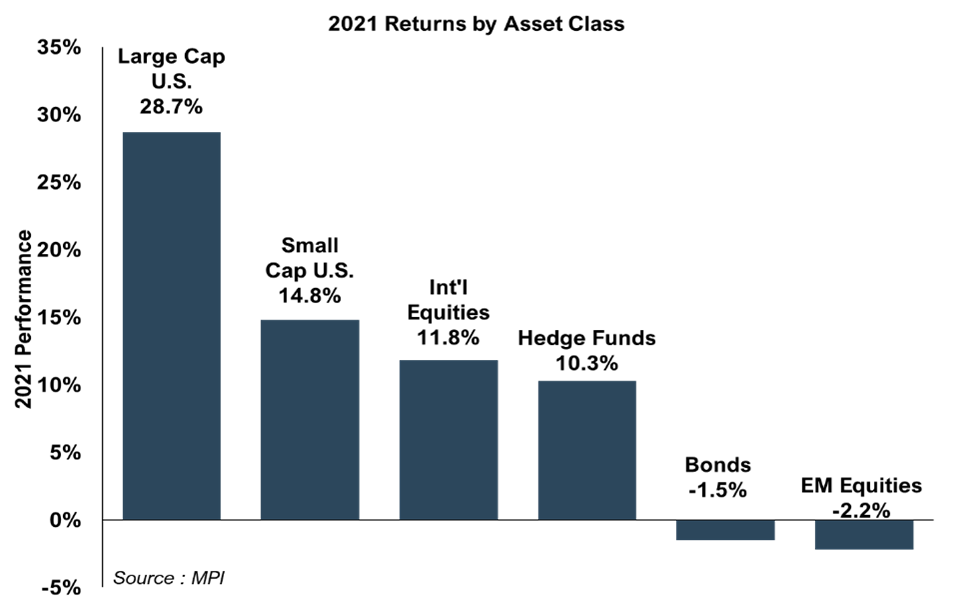
To state the obvious, the chart above1 shows why portfolios with higher exposure to U.S. large caps (S&P 500 Index) generally earned higher returns. So, why bother with all the complication of portfolios diversified over nine asset classes with active management and hedged strategies? We believe it comes down to one word – risk.
Over the course of the remarkable three-year run in the S&P 500, risks embedded in traditional portfolios have been escalating, fueled in large part by the “double subsidies” of fiscal stimulus and monetary policy. The scale is truly hard to comprehend: in 2021 alone, the Federal deficit was 12% of GDP, the balance sheet of the Federal Reserve grew 19%, and the M2 Money Supply expanded 13% – all from already elevated levels. We’ve identified four major risks below but note that they are highly interconnected.
-
Valuations
Valuation metrics vary a great deal depending upon which methodology is employed, but we’ve yet to see any metric that suggests the S&P 500 is cheap today, other than in comparison to bond yields – a rationale that has never made complete sense to us and may be being discredited even as we write (more on that later). A fairly rosy measure is the forward P/E ratio, which incorporates earnings estimates that tend to be optimistic. This is even more true in the current environment given that S&P 500 profit margins were 13.2% as of the third quarter of 2021, more than double the 5.8% in 1994. Using the forward P/E methodology, valuations are modestly above fair value – 125% higher than the average over the last 25 years and 1.3 standard deviations overvalued.
At the other end of the spectrum, Jeremy Grantham, famous for his studies of bubbles and bearish predictions, uses a longer time frame and a cyclically-adjusted methodology which smooths out variability in corporate profits. He concludes that equities are in a rare “Superbubble” (only four in the last 100 years) with the S&P 500 nearly double its trend level as of year-end. Many find his lens old-fashioned, arguing that it fails to recognize that the current environment is marked by different business models earning higher margins (globalization, technological innovations, etc.) and thereby justifying higher valuations. In their most recent Green Book, our friends at Leuthold tested whether this “New Era” (since 1995) hypothesis alters the analysis. Even in the context of the “New Era,” valuations are high and a reversion to the average of the three prior market peaks would result in a decline of -29.0% for the S&P 500 Median Stock from its December 31, 2021 level. While such a decline may or may not occur, it’s clear that current valuations do not provide much margin for safety.
-
Concentration
The returns of the S&P 500 have largely been driven by its mega-cap constituents as the price of the top ten stocks as a basket has gone parabolic. As these stocks have outperformed, their weight in the index has increased to 30.2%, the highest concentration for the top ten stocks in the last 25 years, markedly so for most of this time albeit more modestly so relative to the height of the tech bubble in the late ‘90s. Increasingly, investing in the cap-weighted S&P 500 is a bet on ten companies. Furthermore, these ten stocks trade at a steep premium to the rest of the market. The P/E ratio of these ten companies reached 33.2x or 1.7x the P/E multiple on the remaining 490 stocks, which compares to the average over the last 25 years of 19.8x and 1.3x, respectively.
-
Interest Rates/Inflation
The Fed has successfully engineered ultra-low rates across the yield curve through a combination of holding the fed funds rate down (short-end of the curve) and purchasing bonds (various maturities along the curve). Low interest rates, coupled with accommodative credit markets (no doubt related), have bolstered stock market returns via higher margins and share buybacks. They have been particularly kind to growth stocks as the future cash flows of these growing businesses are valued higher at a low discount rate than they would be in a higher rate environment.
Interest rates have generally cooperated even in the face of burgeoning inflation over the last year, which the Fed initially labeled as “transitory.” The CPI hit 7% for 2021 while the yield on the 10-year Treasury note closed the year at just 1.5%. This combination results in a negative yield of -5.5%, which hardly seems “risk-free.” It remains to be seen how long investors will tolerate that degree of erosion of purchasing power.
A myriad of external factors have contributed to inflation: wage growth due to COVID strains and people leaving the workforce, increased regulatory costs, supply chain disruptions, reshoring expenses to address supply chain weaknesses, higher energy costs after years of underinvestment, and expanded cradle-to-grave benefits. The Fed has acknowledged that inflation has been more persistent than expected, started tapering bond purchases in November, and is expected to start hiking rates in March. Still, many fear that it is dangerously behind the curve, repeating policy errors of the 1970s when the Fed blamed inflation on external factors rather than the growth in money supply. Milton Friedman famously said, “Inflation is always and everywhere a monetary phenomenon.”
-
Contagion
Abundance of liquidity in the system via a powerful combination of monetary policy (bond buying) and fiscal policy (stimulus checks) has contributed to speculative excesses beyond the S&P 500. As we have seen in past cycles, the unwinding of excesses can spread pain broadly and severely, often regardless of the quality and fundamentals of individual companies. Consider the damage that followed the housing bubble of 2006 and 2007, itself in part the product of some well-meaning policies designed to expand home ownership.
In the last two years, trading approached mania in SPACs, meme stocks, cryptocurrencies, NFTs, concept stocks, innovators, and disruptors, although a severe down leg in many of these securities started in February of 2021.
We may be seeing some of these factors at work as the market seems to have shifted from FOMO (Fear of Missing Out) to outright fear in the opening weeks of 2022. In recognition of tighter monetary policy, the yield on the 10-year Treasury has risen modestly to 1.8% (still well below long-term averages) and bond prices have declined - 2.0% through January 25th. Stocks have declined sharply (S&P 500 down -8.7%) with growth stocks hit much harder, presumably due to the specter of higher interest rates. In fact, the concentration of indices in the largest constituents masks the pain felt more broadly in the markets … consider, as of January 25th, the Russell 3000 was down -11.5% from its peak earlier this year, while the average constituent stock was down -34.6%. The tech-laden Nasdaq was down -17.3% from its peak on November 22, 2021, but the average Nasdaq constituent stock is down -46.6%. Those relationships indicate an unprecedented narrowing, pervasive across all domestic markets. They also suggest a measure of indiscriminate selling, and many of our managers report more compelling buying opportunities than they have seen in quite some time.
The negative return for bonds in a rapidly correcting equity market highlights a challenge we have been writing about for some time:
So, where exactly does an investor look for defensiveness in today’s low rate, high valuation world? The prescription that we have followed for most of our careers has been hedging and diversification. Hedging is our front line of defense. Hedging is obviously no substitute for U.S. Treasury bonds in the throes of a crisis, but it can assist in providing healthy returns with modest risk and volatility for investors with at least an intermediate time horizon.
Our second line of defense is our broad and deliberate approach to diversification across nine independent asset classes. It’s not enough just to be different; we seek investment strategies which are tied to different drivers of return and executed by talented active managers. One very small example of this is within the private equity space and a group that buys tired, neglected consumer brands and reinvigorates them. This team has very longstanding ties to Walmart and other retailers, which helps them to revive the brands and drive sales and profits. Their success or failure here is two parts market related and eight parts manager skill. Market gyrations will have little impact on the ultimate success or failure of this approach.
Take that example times dozens of industries, geographies, managers and investment approaches and you get a picture of our approach to diversification. The role of active management is equally important in the public markets in times of dislocation like we are living through today. Holding, and even adding to, high confidence positions in volatile times can sow the seeds of future returns. Such an approach is somewhat underappreciated when a traditional mix of stocks and bonds implemented by cheap and liquid indices dominates as it has these last few years. We believe the story will be markedly different when we look back five and ten years from now.
Jeremy Grantham’s latest piece, “Let the Wild Rumpus Begin”, sees bubbly conditions in housing greater than in 2006 and an incipient bubble in commodities in addition to the risks embedded in stocks and bonds, making current conditions particularly perilous. It is worth considering as one potential scenario, although we caution you to carefully consider when you decide to take this information in. It is sobering, indeed. Below is a quick summary:
Rules of The Bubble Reviewed
-
All 2-sigma equity bubbles in developed equity markets have burst – all the way back to trend. The U.S. reached the 2-sigma level in the summer of 2020.
-
But some of them went to 3-sigma or more before they burst – producing longer and deeper pain. The U.S. reached 3-sigma in late 2021.
-
Timing is uncertain and when you get to 3-sigma superbubbles, such as we have now, there are few examples. Yet they have all shown certain characteristics before they broke.
-
A speculative investor frenzy that generated stories for distant decades, which we have had for well over a year;
-
A penultimate blow-off phase where stock gains accelerate, as we had in 2020;
-
And the ultimate narrowing phase – unique to these few superbubbles – where a decreasing number of very large blue chips go up as riskier and more speculative stocks underperform or even decline, as they did in 1929 and 2000 and as they have done since February 2021.
-
We’ve been doing this too long to pretend that we know what the future holds, but the potential of three bubbles bursting contemporaneously certainly brings an appreciation for risk into focus. Grantham has been bearish for a long time all while the U.S. stock market has continued to run, and we’re sure his investors have been frustrated. His work, however, is a fact-based, historical analysis, and we think it’s important to appreciate potential risks, even if the worst case does not materialize. We are not advocating going to cash and moving to the sidelines. That is almost certainly a losing proposition. Still, a clear-eyed view of the state of the markets and the potential for downside warrants caution and the use of all the tools available. We urge investors to resist the calling of FOMO and pursue a diversified investment approach which balances return and risk.
January 2022
Tara Elliott & Charles Gerber
1 The asset classes are represented by the following indices: Large Cap U.S. (S&P 500), Small Cap U.S. (Russell 2000), International Equities (MSCI EAFE), Hedge Funds (HFRI Fund Weighted Composite), Bonds (Bloomberg U.S. Aggregate), EM Equities (MSCI Emerging Markets)